🔍 Part 1 – Overview of the Prompts Tab
The Prompts section in Qwairy lets you analyze and monitor the key questions users are asking about your brand across various platforms and AI providers.
 This view helps you understand:
- What topics are associated with your brand
- How visible your brand is across relevant prompts
- Which competitors are also being mentioned
- Which AI providers surface your brand in their answers
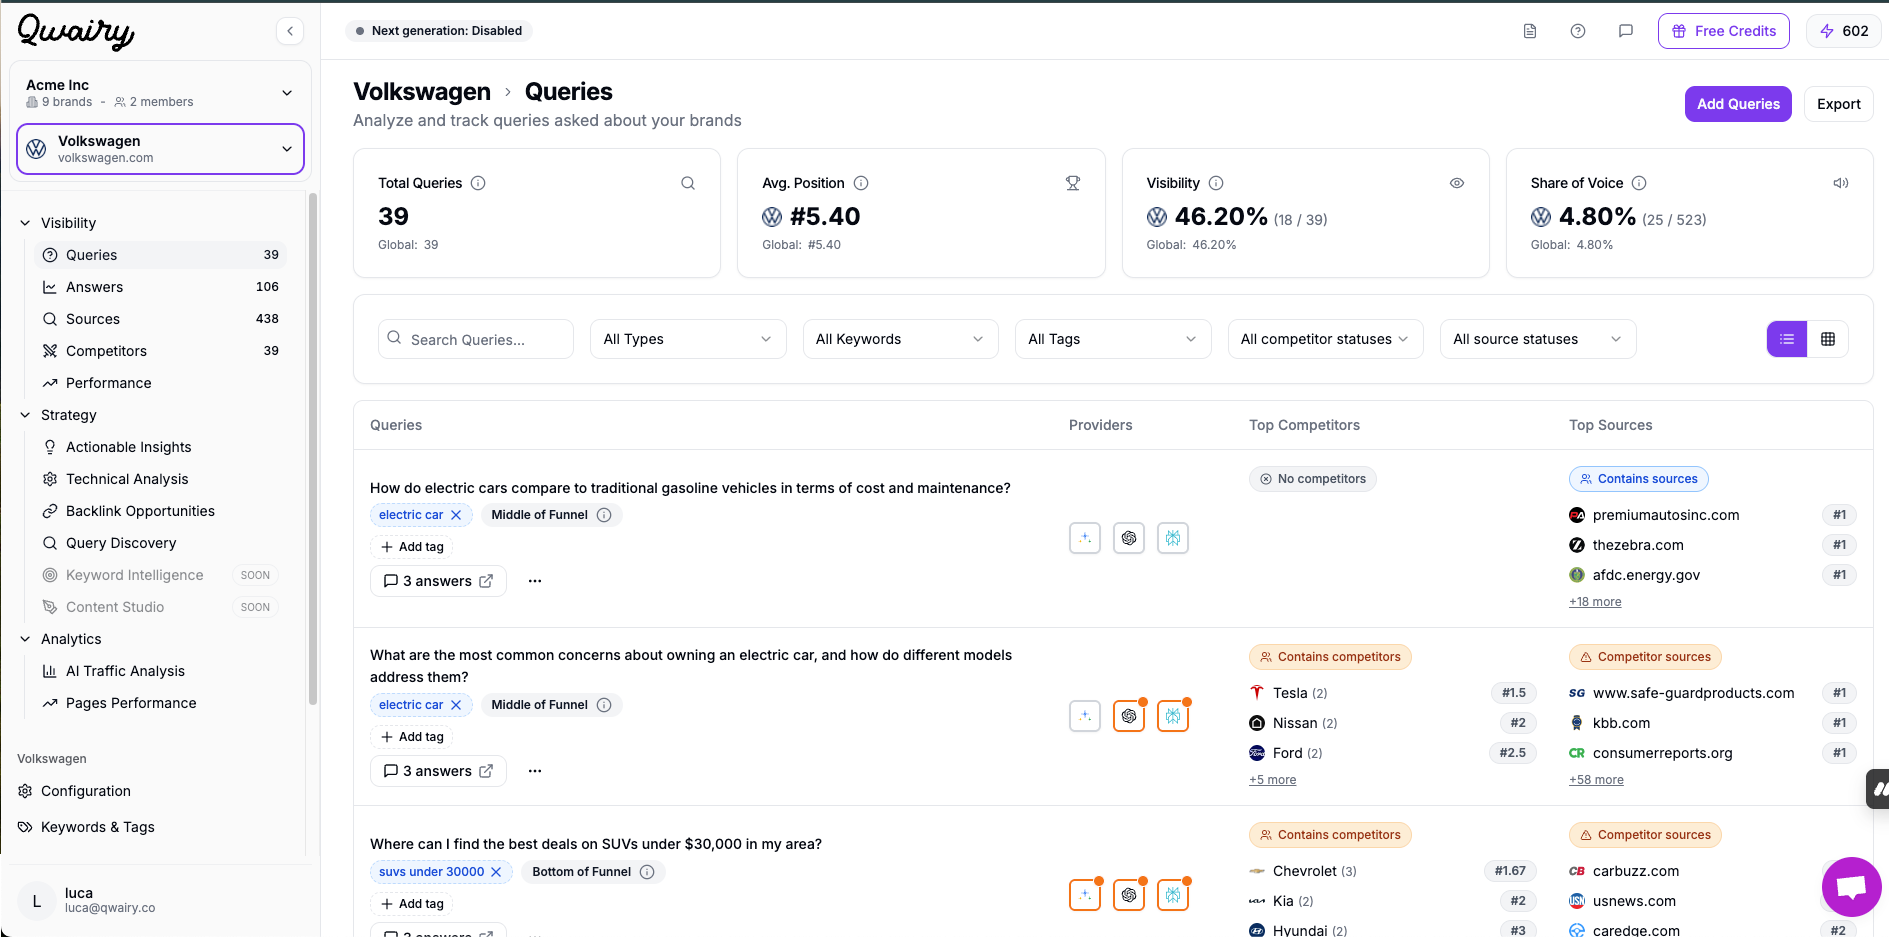
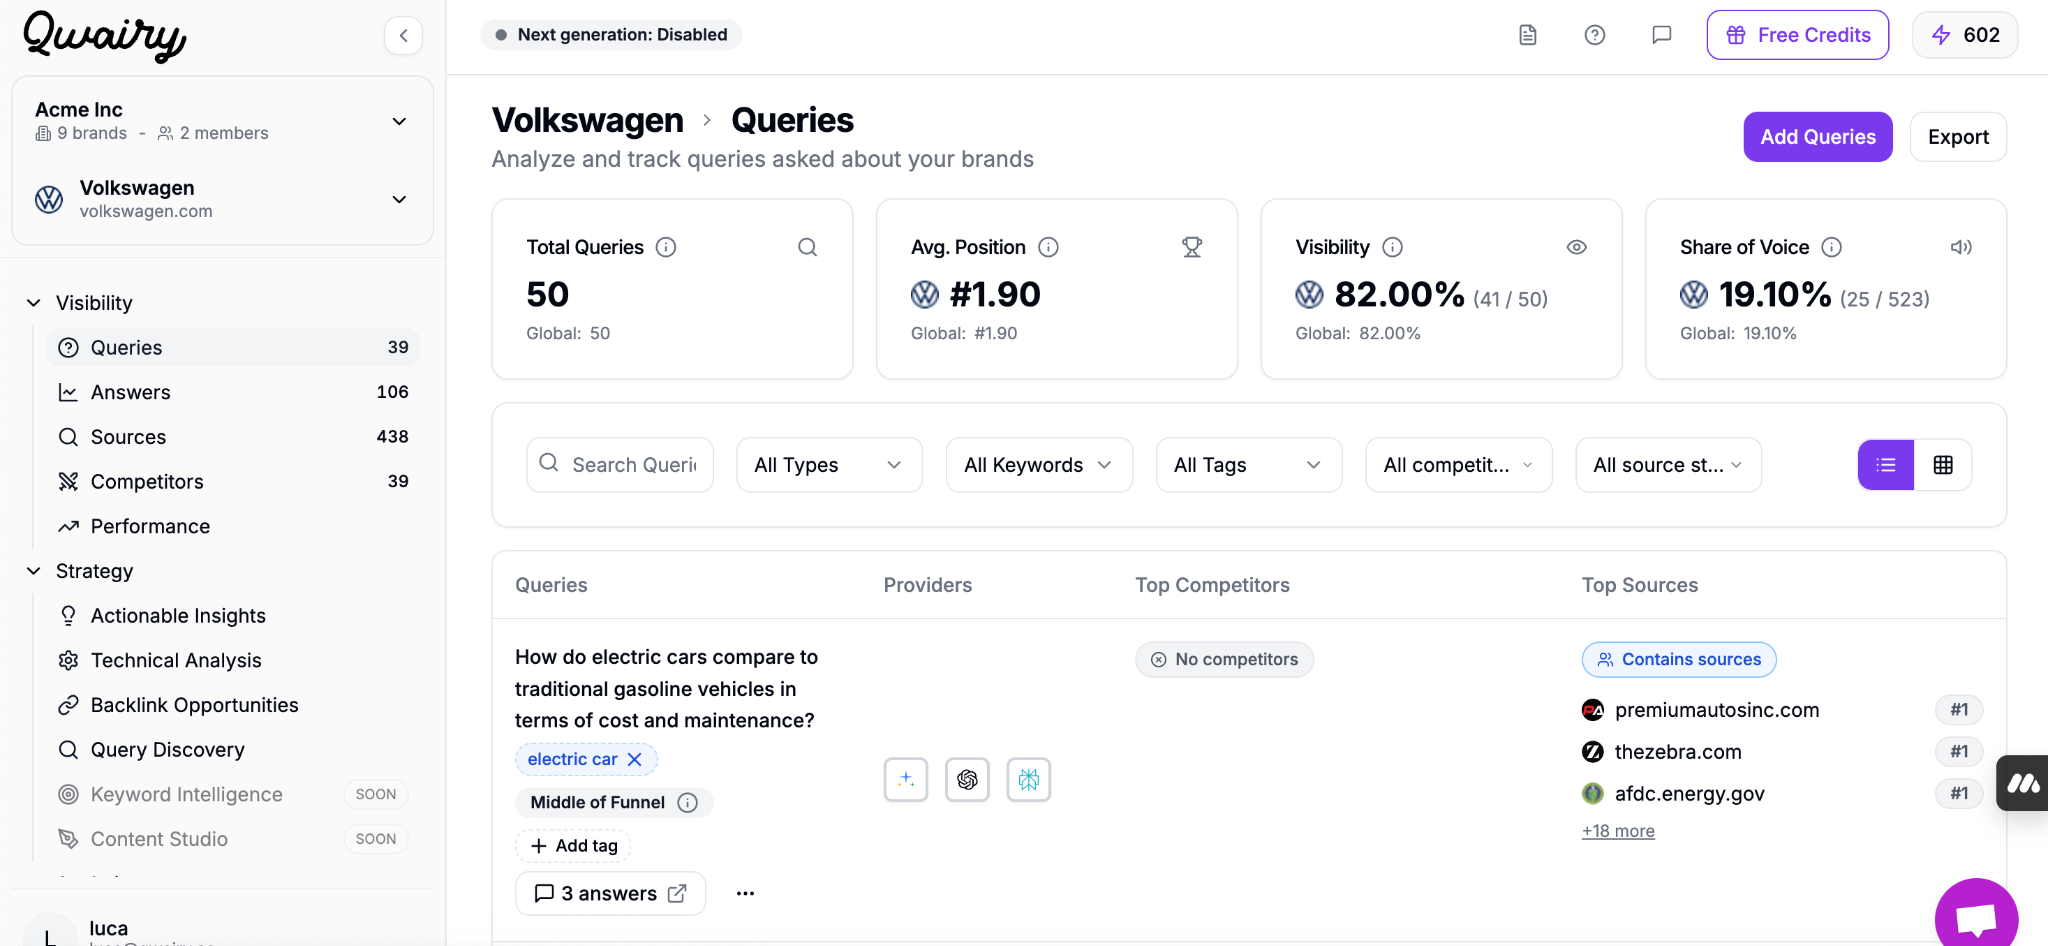
At the top of the page, you’ll find four essential metrics:
-
Total Prompts
The number of tracked prompts that mention or relate to your brand.
Example: 50 prompts currently tracked for Volkswagen.
-
Average Position
Your average ranking across all prompts where your brand appears.
Example: Volkswagen has an average position of #5.40.
-
Visibility
The percentage of prompts in which your brand is mentioned at least once.
Example: 82% visibility means your brand is visible in 41 out of 50 prompts.
-
Share of Voice
Out of all brand mentions in AI responses (yours and your competitors’), the percentage that are yours.
Example: Volkswagen has a 4.80% share of voice across 523 total brand mentions.
These KPIs give you a high-level view of your brand’s presence and performance in real search-like or AI-generated prompts.
➕ How to Add Prompts
You can add prompts in two ways:
- Manually, using the “Add Prompts” button in the top right corner of the interface.
- Automatically, by completing the onboarding flow, which suggests initial prompts based on your brand and industry.
🧭 Part 2 – Navigating the Prompt Table
The core of the Prompts tab is a detailed table showing every prompt you’re tracking. Each row corresponds to a unique user question and includes rich context to help you evaluate brand performance and competitive landscape.
🔠 Columns in the Prompt Table
Each prompt includes the following key elements:
-
Prompt Text
The actual question asked (e.g., “How do electric cars compare to traditional gasoline vehicles in terms of cost and maintenance?”)
-
Tags & Funnel Stage
You can assign tags to organize prompts by theme (e.g., electric car, suvs under 30000) and label them by funnel stage (Top / Middle / Bottom of Funnel).
Helps you understand where in the customer journey the prompt belongs.
-
AI Providers
Icons indicate which AI models are answering the prompt:
- ✦ AI Overview
- 🔵 OpenAI
- 🟠 Anthropic
- 🧊 Perplexity
- 🌠 Google Generative AI
-
Top Competitors Mentioned
This shows which competitor brands were mentioned in responses to this prompt. You’ll also see how many times each was mentioned.
Example: Tesla, Nissan, and Ford appear in a prompt about electric car concerns.
-
Top Sources
The most influential sources that were cited across providers when answering this prompt. You can view their rank, domain, and how often they were used.
-
Response Count
The number of total responses across providers that responded to this prompt (e.g., “3 responses”).
🔍 Part 3 – Filters & Prompt Exploration
To help you dig into the most relevant insights, the Prompts interface includes a powerful set of filters.
🧩 Available Filters
You can refine your view using the following options:
- Search Bar
Quickly locate specific prompts by typing part of the question text.
- Prompt Type (Funnel Stage)
Filter by where the prompt falls in the user journey:
- Top of Funnel (awareness-based prompts)
- Middle of Funnel (comparison or consideration)
- Bottom of Funnel (purchase-intent or pricing)
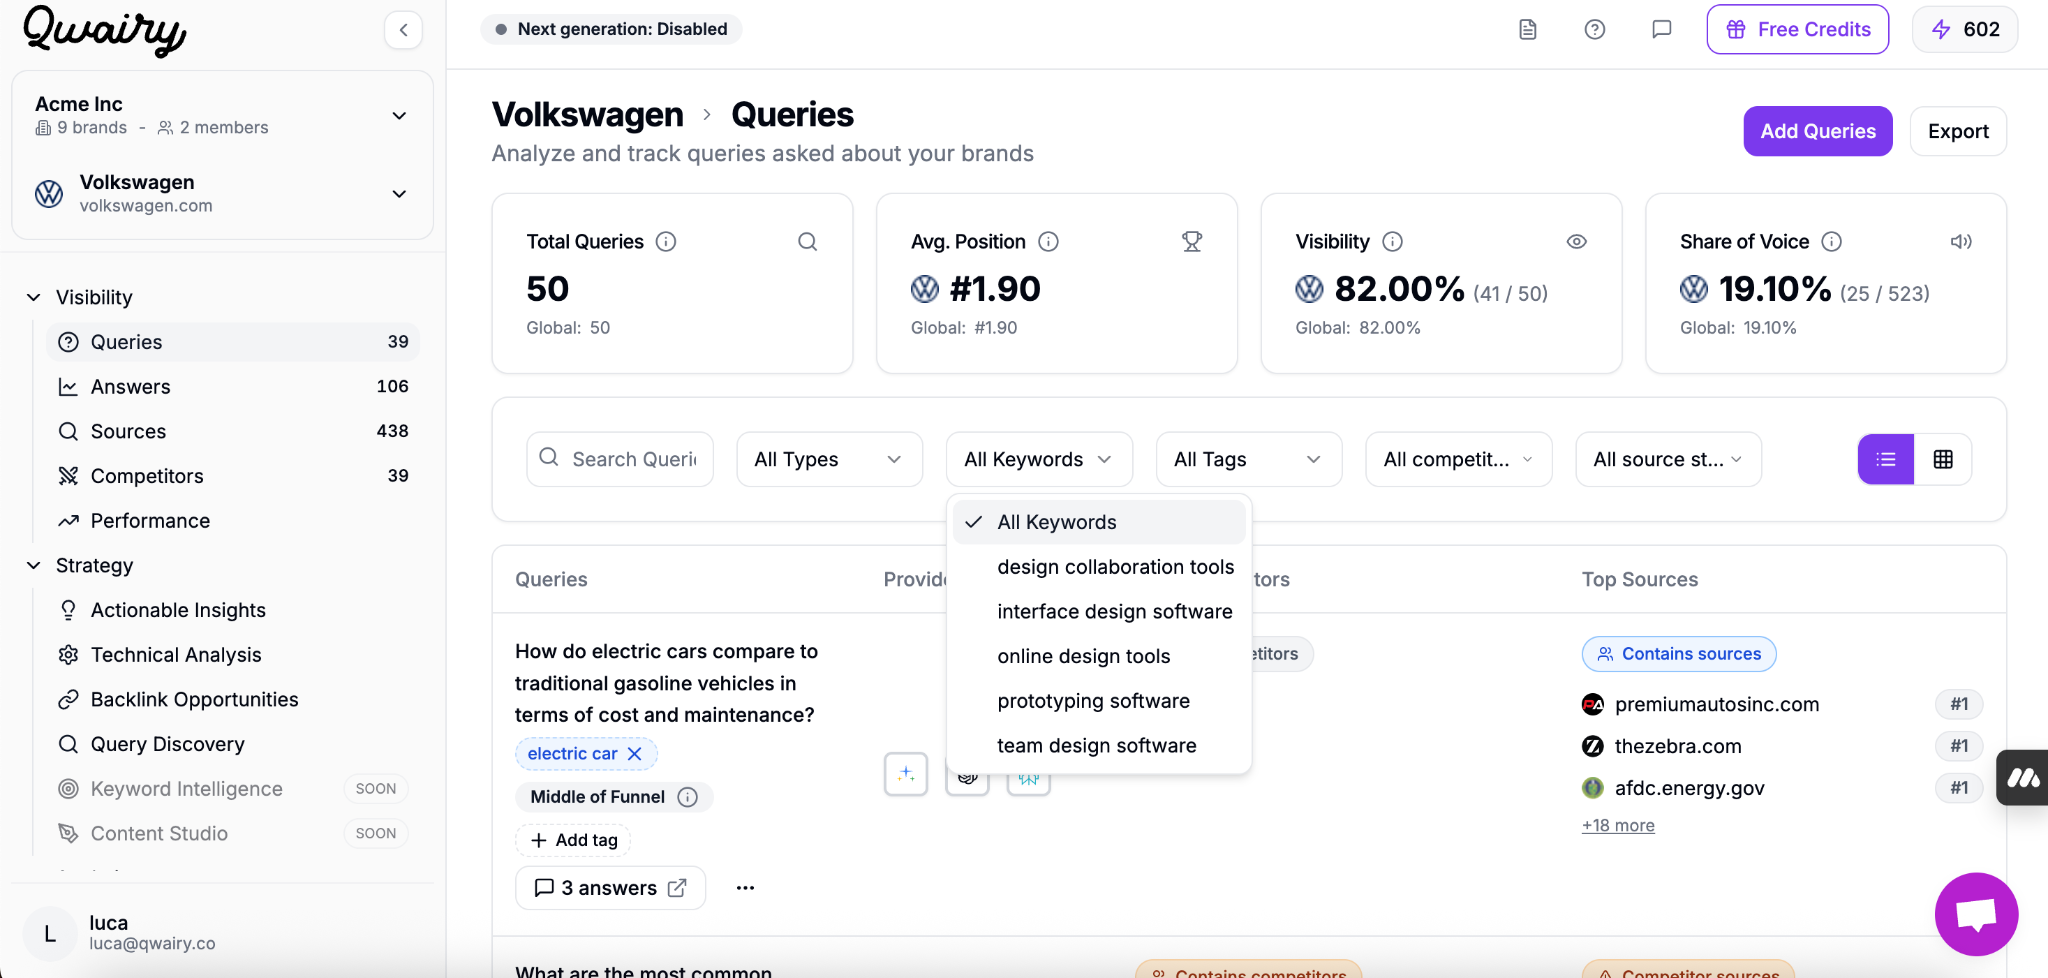
- Topics
Only view prompts related to specific topics. Helpful to zoom in on core product topics (e.g., “electric car”, “design software”).
-
Tags
Filter by tags that your team has applied to prompts manually — for example: Sustainability, EV Market, Luxury, Under 30k, etc.
-
Competitor Mentions
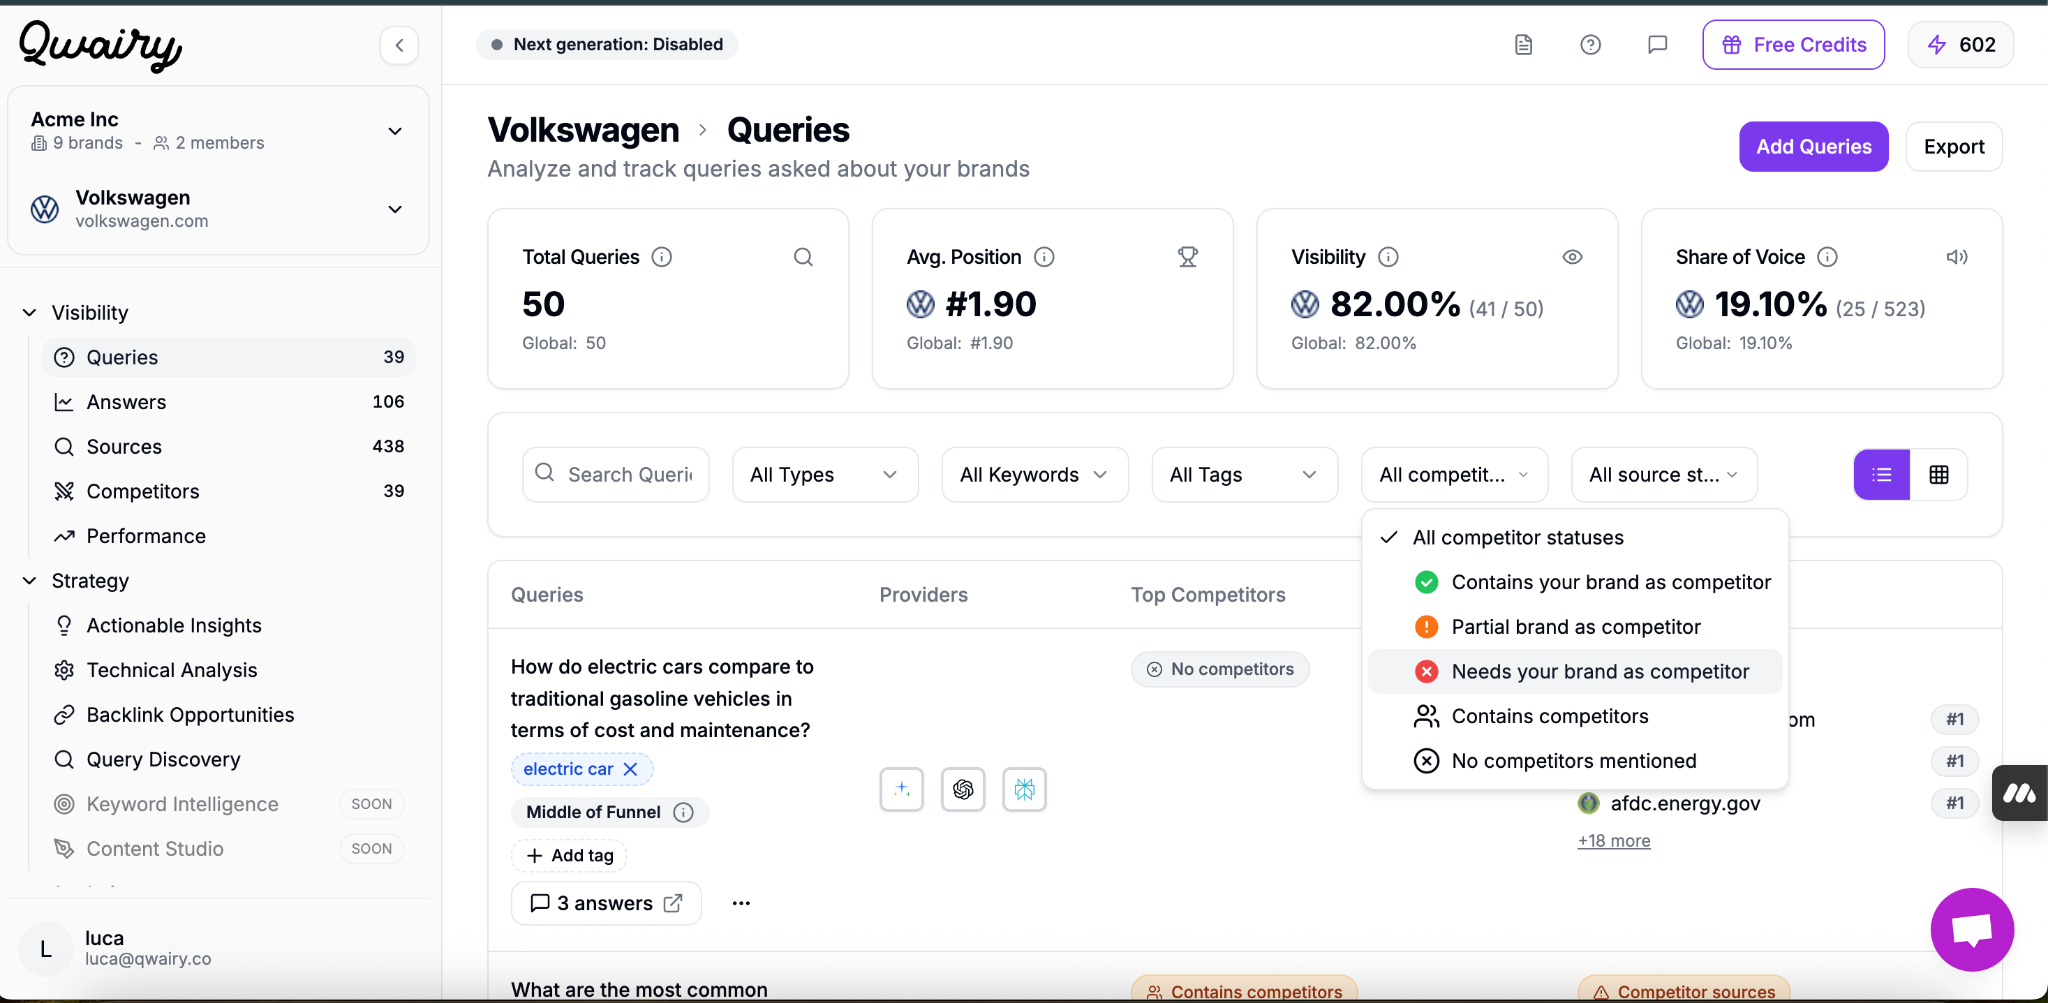
Segment prompts based on whether and how competitors are present:
- ✅ Mentions your brand
- ⚠️ Mentions your brand partially
- ❌ Needs your brand as a competitor
- 🔁 Mentions other competitors
- 🚫 No competitors mentioned
-
Source Status
See if the prompt is backed by strong content sources or not — a helpful signal to identify where you might need to improve credibility.
⚙️ Part 4 – Managing Prompts
Qwairy gives you full control over your prompt set so you can continuously adapt to your brand strategy, audience questions, and AI visibility goals.
➕ Add New Prompts
To add prompts manually:
- Click the “Add Prompts” button in the top-right corner of the Prompts tab.
- Enter one or more natural-language prompts (e.g., “Is Volkswagen a good electric car brand?”).
- Assign optional tags and funnel stages.
- Select which AI providers you want Qwairy to analyze the prompt with.
💡 You can add as many prompts as needed — whether they’re general questions or highly targeted use cases.
Use custom tags to group prompts by:
- Business priority
- Product line
- Campaign
- Language or geography
- Funnel stage or content theme
Tags are displayed directly in the table and can be used as filters.
🗑 Delete Prompts
To clean up your prompt list:
- Click the three-dot menu (⋯) next to a prompt
- Select “Delete” to permanently remove it
Deleting a prompt removes all associated responses and analytics. This action cannot be undone.