Navigate to Cockpit > Overview in the left navigation menu (the brand root page).
The Performance Dashboard is Qwairy’s central hub for tracking how well your brand shows up in AI-generated answers from models like ChatGPT, Perplexity, Gemini, Claude, and more.
It doesn’t just tell you if your brand is mentioned — it tells you where, how often, in what tone, and with what share of voice.
On this documentation page we will detail how you can use this performance dashboard to take strategic decisions.
1. 🔍 Overview of Key Metrics
At the top of the dashboard, you’ll find 5 core performance indicators:
| Metric | What it tells you |
|---|
| Mention Rate | Out of all AI responses that mention any brand, what % mentions yours |
| Citation Rate | Out of all AI responses that cite any source, what % cites yours |
| Share of Voice | Out of all brand mentions in AI responses, what % is yours |
| Average Sentiment | The tone (positive/neutral/negative) associated with your brand |
| Coverage | Out of all monitored prompts, in what % does at least one AI response mention your brand |
💡 Pro Tip: A high mention rate without source citations can be risky. It means you’re talked about, but others control the narrative. Focus on both visibility and authority.
2. 📈 Deep Dive into Metrics
🟠 Mention Rate (Brand Mention Visibility)
- Out of all AI responses that mention any brand, the percentage that mention yours.
- Example: 27% means your brand appears in just over a quarter of the responses where at least one brand is mentioned.
The denominator is the set of AI responses that mention at least one brand
(yours or a competitor’s), so Mention Rate reflects your share of the
brand-relevant conversation.
- Identify where you’re absent and why
- Benchmark yourself against top competitors in your space
📎 Citation Rate (Source Citation Visibility)
- Measures how often your own site or content is cited as a source.
- Example: 0% means you’re never referenced — even if you’re mentioned.
⚠️ AI may talk about your brand but rely on external sources, including your competitors.
💡 Pro Tip: Improve this by updating your website content, publishing on trusted platforms (Wikipedia, Crunchbase, news sites), and ensuring pages have structured, factual information.
🏅 Average Position
- Your average rank when multiple brands are mentioned in the same answer.
- If you’re frequently mentioned but rank behind others (e.g., Toyota, Ford), your visibility is present but not dominant.
This score is especially useful when competing in crowded markets.
😀 Average Sentiment
- Indicates how positively (or negatively) your brand is portrayed in AI responses.
- Score from 0 to 100 — the higher, the better.
- Useful for reputation tracking, product perception, and brand positioning.
📢 Share of Voice
- Out of all brand mentions in AI responses (yours and your competitors’), the percentage that are yours.
- Example: If you have 25% Share of Voice, your brand represents a quarter of all brand mentions in your competitive landscape.
- Calculated as:
(Your brand mentions ÷ All brand mentions) × 100, where the denominator counts your mentions plus every competitor mention.
🎯 Use this to:
- Benchmark market dominance: Higher Share of Voice indicates stronger AI visibility leadership
- Track competitive positioning: Monitor if competitors are gaining ground in AI conversations
- Identify growth opportunities: Low Share of Voice reveals potential for increased AI presence
💡 Pro Tip: A declining Share of Voice might indicate competitors are creating more AI-friendly content or getting better source citations. Use this metric to prioritize your content strategy.
📊 Coverage
- Out of all monitored prompts, the percentage where at least one AI response mentions your brand — regardless of whether competitors are mentioned.
- Unlike Mention Rate (which is scoped to responses that mention at least one brand), Coverage measures your broad presence across every monitored prompt.
🎯 Use this to:
- Measure topic breadth: Higher Coverage means your brand appears across more of your monitored landscape
- Identify blind spots: Low Coverage on specific topics reveals where you’re completely absent
- Track expansion: Monitor Coverage over time as you create content for new topic areas
Qwairy breaks down your visibility by LLM model (e.g., ChatGPT, Sonar, AI Overview):
| Provider | Brand Mentions | Source Citations | Sentiment |
|---|
| AI Overview | 32% | 0% | 71.4 |
| Sonar | 29% | 0% | 64.4 |
| GPT‑5 Mini | 24% | 0% | 71.3 |
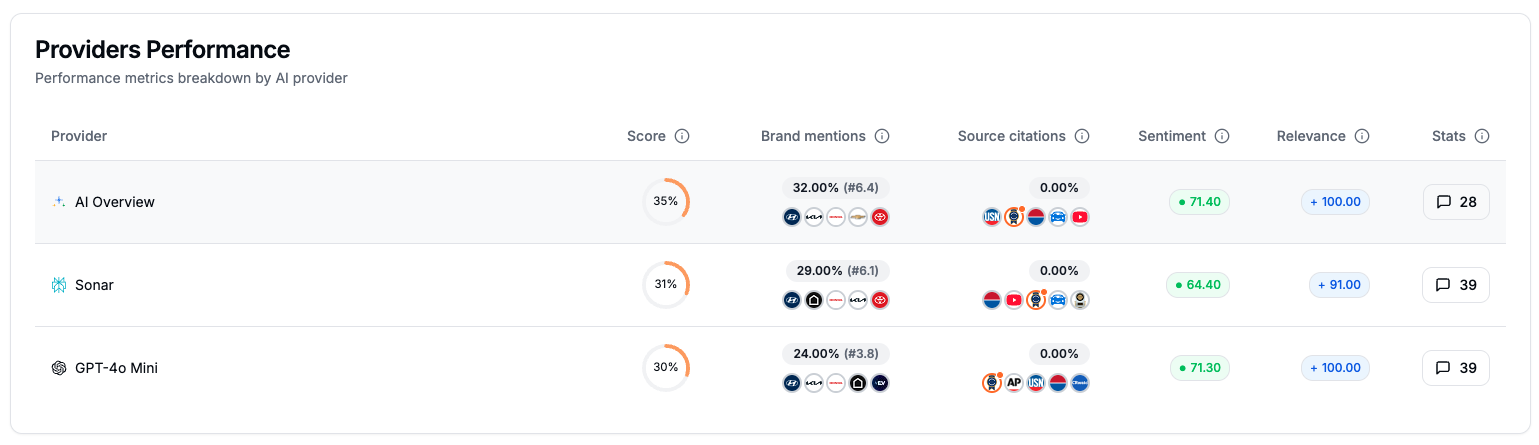 💡 Pro Tips: Depending on where you’re lacking visibility you can define your backlink strategy. If you are absent from ChatGPT you might want to make sure you are present on the sources it relies on.
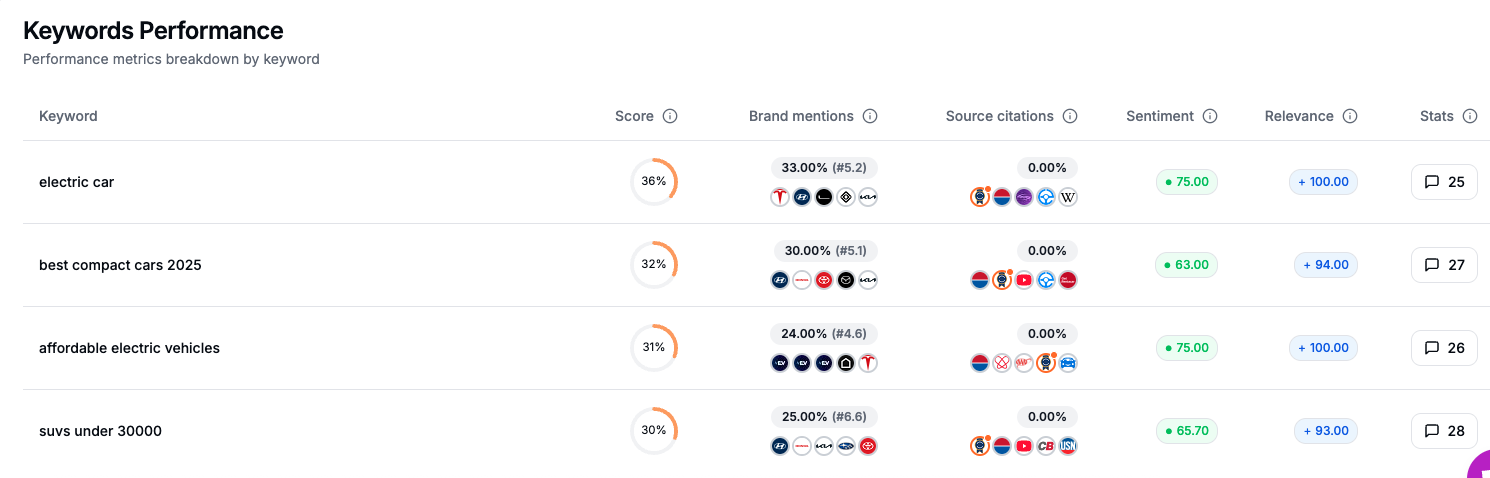 Explore how you perform on each strategic topic (e.g., “electric cars” or “SUVs under $30k”):
- Presence rate
- Ranking position
- Source citation rate
- Sentiment score
Example:
You’re mentioned in 33% of queries about “electric cars” — but cited 0%.
That means you’re visible but not trusted as a source. Content opportunity spotted.
6. Top Sources Impact
The Top Sources Impact section in Qwairy shows which external websites have the greatest influence on how your brand is represented in AI-generated answers.
LLMs (Large Language Models) don’t just pull information from your website — they draw from trusted external sources. This view helps you answer two essential questions:
- 💡 “Which domains are shaping how my brand is portrayed?”
- 💡 “Am I present in the sources AI models trust the most?”
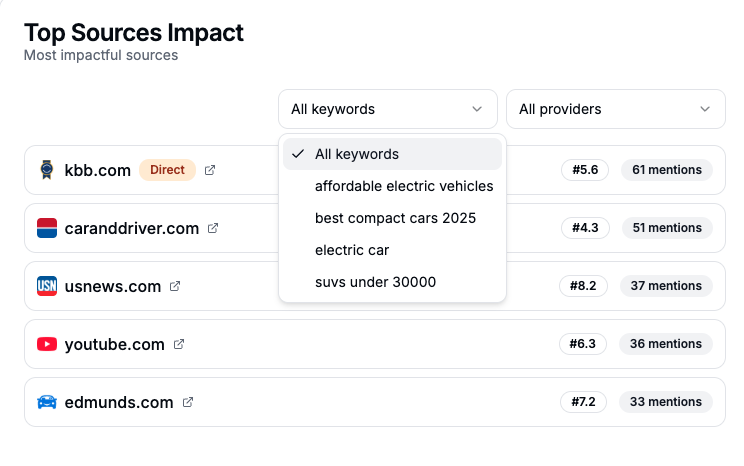 💡 Tip: If a site like
 kbb.com is often cited and your brand isn’t mentioned there → get listed, publish content, or update outdated info on that platform.
Granular Insights by Keyword & Provider
Qwairy gives you the power to filter source impact data:
✅ By Keyword (Topic-specific view)
You can analyze source impact for each keyword or theme, such as:
electric caraffordable electric vehiclessuvs under 30000best compact cars 2025
👉 This allows you to understand which sources dominate a specific conversation.
Example:
youtube.com may dominate on “SUV reviews”usnews.com might be stronger on “affordable EVs”
This helps you prioritize where to be visible based on your positioning goals.
✅ By Provider (AI model-specific view)
Since LLMs don’t use the same sources, you can also filter by:
- ChatGPT
- Claude
- Gemini
- Sonar
- AI Overview
👉 This helps you tailor your efforts to the AI model most used by your audience.
The Top Competitors Performance module in Qwairy shows you which brands are most frequently mentioned in AI-generated answers — and how they’re performing relative to yours.
This section is essential to understanding:
- Who dominates your category in AI search
- How each competitor is perceived
- Where you might be underrepresented
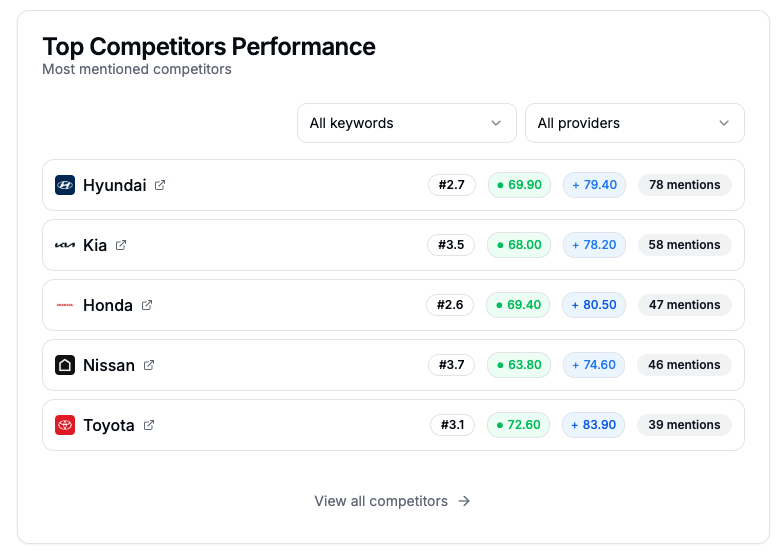
🔁 Filter by Keyword or Provider
You can go very granular by slicing this data:
✅ By Keyword
See which competitors dominate specific themes or verticals, such as:
- “Electric cars”
- “Affordable SUVs”
- “Best compact cars 2025”
→ This reveals who is winning per topic, so you can identify gaps and focus your content efforts strategically.
✅ By Provider
Filter by AI model (ChatGPT, Sonar, Claude, etc.) to:
- See which competitors are favored by each LLM
- Understand if some models are skewed toward certain brands
- Adjust your content strategy accordingly