

Date filtering
All data sources support Looker Studio’s native date range controls. Add a Date Range Control to your dashboard to filter data dynamically.If no date range is specified, data defaults to the last 90 days.
Data volume
The connector requests rows for the selected date range and dimensions. Large ranges or high-cardinality fields can make a report slower or harder to read. Narrow the date range and request only the fields required by the chart before splitting the report into several data sources.Common issues
Unable to complete authorization
When the authorization step shows “This app is blocked” with no option to proceed: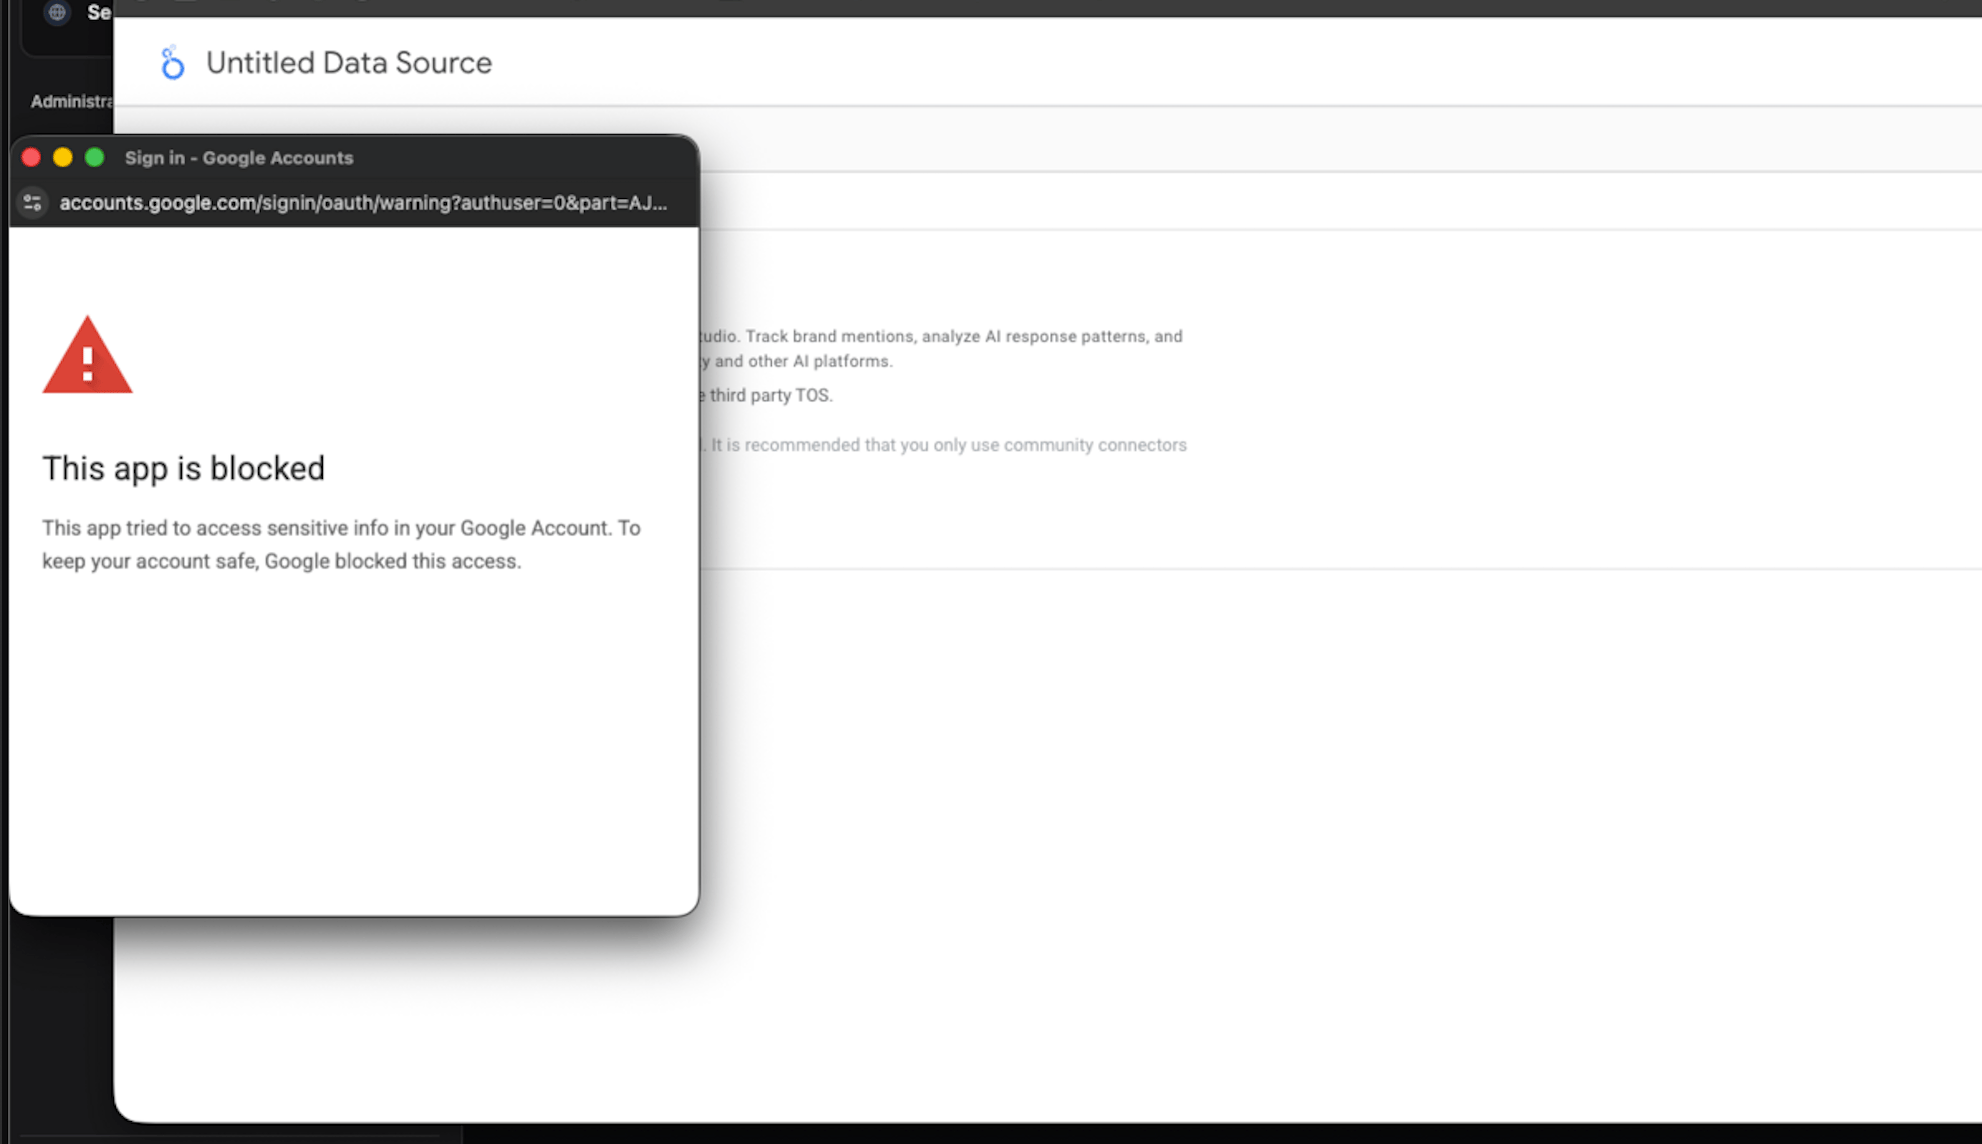
- Open Google Admin Console
- Go to Security → API Controls
- Click Manage Third-Party App Access
- Allow access for the Qwairy connector
No data appearing in reports
- Verify your API token is valid in Team Management
- Ensure the selected brand has monitoring data
- Check that the date range includes dates with data
- Confirm your team subscription is active
How to refresh data
Looker Studio caches data for performance. To refresh:- Click the Refresh data button in your report
- Or set up automatic refresh in your data source settings
New fields do not appear after a connector update
When Qwairy adds or changes connector fields, existing Looker Studio data sources keep their previous schema until you refresh it manually:- Open your report in edit mode
- Go to Resource → Manage added data sources
- Click Edit on the Qwairy data source
- Click Refresh fields
- Confirm the field changes
coverage,
responseCoverage, competitorId, brandMentionedLabel,
totalBrandMentions, or ownBrandMentions.
Numbers in Looker do not match the Qwairy interface
On Performance Overview and Keyword Performance, ratio metrics are calculated from raw counters in Looker Studio:SUM(numerator) / SUM(denominator). This avoids averaging provider rows and
keeps totals aligned with the Qwairy interface. If your dashboard still shows
older numbers, refresh the schema:
Resource → Manage added data sources → Refresh fields.
On Competitor Metrics, rows are grouped by competitorId and aggregated
across all providers/models. The provider and model dimensions remain
available for compatibility, but their values are All Providers and
All Models.
For source reports, use isCompetitor, relationship, competitorId, or
competitor for synchronized filters across Source Domains and
Source URLs.
”Mentioned in period” vs “Total tracked” competitors
Competitor Metrics rows only include competitors mentioned in the selected period.totalTrackedCompetitors returns the brand-level registered count
(constant, ignores filters). Combine them for a coverage ratio: